
Bitcoin falls 51%, but is the four year cycle intact?
 AI image
In short
- Bitcoin reached a record near 126,199 dollars in October 2025 before falling to around 62,000 dollars.
- The four year cycle is linked to the halving of the reward paid to Bitcoin miners.
- Previous cycles show a recognisable pattern, but timing and price movements vary.
- Research published in 2026 suggests the influence of the traditional cycle may be weakening.
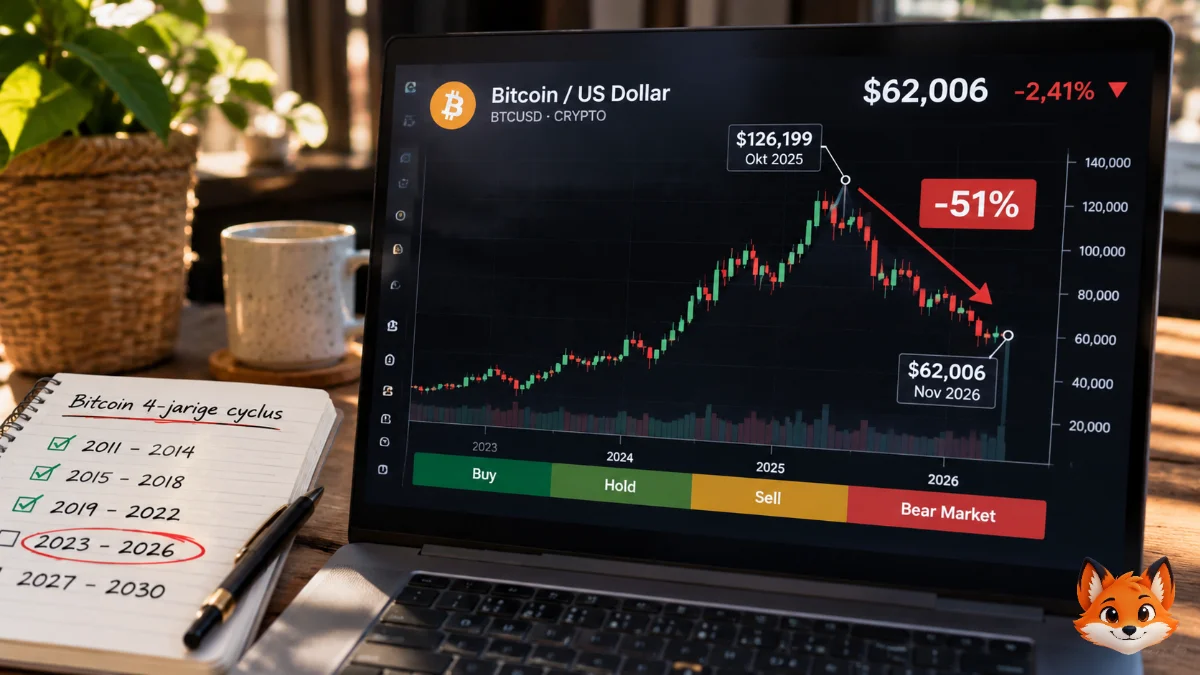
Bitcoin reached a record price of around 126,199 dollars in October 2025. By November 2026, the price had touched roughly 62,000 dollars. That is about half the peak. For many Bitcoin investors, the move feels familiar. Previous record years were also followed by long periods of falling prices.
The explanation that often comes up is the Bitcoin four year cycle. According to this pattern, a period of accumulation and rising prices is eventually followed by a peak and a bear market. The calendar appears to be pointing in the same direction again. But how does the cycle work, and does it mean that 2026 is automatically a good time to buy?
The Bitcoin halving sets the clock in motion
The cycle starts with Bitcoin's code. Roughly every four years, the reward miners receive for adding a new block to the blockchain is cut in half. This event is called the halving. Miners receive fewer newly created bitcoins for the same type of work.
The first halving took place on 28 November 2012. The reward fell from 50 to 25 bitcoin per block. The second halving followed in July 2016, reducing the reward from 25 to 12.5 bitcoin. In May 2020, it fell to 6.25 bitcoin. The most recent halving took place on 20 April 2024. Since then, miners have received 3.125 bitcoin for each new block.
What does that mean? The halving slows the rate at which new bitcoins enter the market. Fewer new coins are issued. This changes supply, but it does not determine the market price on its own. Demand for Bitcoin, interest rates and investor behaviour also matter.
The next halving is expected around 2028. The exact date is not fixed on a calendar because the network works in blocks. Its target is an average of one new block every ten minutes.
Four cycles show a striking rhythm
The familiar model divides Bitcoin history into periods of roughly four years. The phases are often described as buy, hold, sell and bear market. Here is the simplified pattern:
| Cycle | Build up | Hold | Peak phase | Bear market |
|---|---|---|---|---|
| 2011 to 2014 | 2011 | 2012 | 2013 | 2014 |
| 2015 to 2018 | 2015 | 2016 | 2017 | 2018 |
| 2019 to 2022 | 2019 | 2020 | 2021 | 2022 |
| 2023 to 2026 | 2023 | 2024 | 2025 | 2026 |
| 2027 to 2030 | 2027 | 2028 | 2029 | 2030 |
This is a simplified model. The market does not move neatly into a new phase on 1 January. Previous tops and bottoms did not always fall in the same calendar year either. Fidelity identifies November 2013, December 2017 and November 2021 as important previous peaks. The next major peak arrived on 6 October 2025.
The pattern is striking. Still, there are only a few complete cycles available for comparison. That is a small dataset on which to build a fixed rule.
Bitcoin has lost about half its peak value
The latest cycle reached a new record in October 2025. Bitcoin climbed to around 126,199 dollars. In November 2026, the price touched roughly 62,006 dollars. That represents a decline of about 50.9 percent.
The same move becomes more tangible when translated into euros. Imagine buying 10,000 euros of Bitcoin at the peak. If the price then falls by 50.9 percent, that position is worth about 4,910 euros. The paper loss is around 5,090 euros. This example only shows the price movement and excludes exchange rates, fees and taxes.
In numbers: A Bitcoin position worth 10,000 euros falls to around 4,910 euros after a 50.9 percent decline. The paper loss is about 5,090 euros. From that lower level, Bitcoin would need to rise by more than 100 percent to return to its previous peak.
These figures explain why the cycle attracts so much attention. But anyone who assumes that every decline automatically marks the market bottom faces one problem: nobody knows in advance where that bottom will be.
The cycle is not a reliable calendar for buying
The labels buy, hold and sell are easy to add to a chart after the fact. Before a peak or bottom happens, nobody knows exactly when it will arrive. The market can turn months earlier or later than the familiar pattern suggests.
In March 2026, Fidelity warned that the four year cycle does not last exactly four years and that the historical data is limited. According to Fidelity, an investor who simply chooses to sell four years after a previous peak may miss a large part of the decline before that date arrives.
The market itself has also changed. Bitcoin is now available through exchange traded products and is traded by larger professional investors. Capital flows, interest rates and broader financial markets can therefore have more influence on its price.
A study published in Finance Research Letters in November 2026 adds another qualification. The researchers found that the familiar four year pattern weakened after May 2023. When they accounted for the broader stock market, the remaining pattern lost its statistical significance.
The next cycle starts in the model in 2027
In the supplied timeline, 2026 is the bear market year. The next accumulation phase starts in 2027. The next halving follows in 2028, with 2029 marked as the peak year and 2030 as the next bear market.
That is a scenario based on previous patterns, not a fixed view of the future. Even if the halving happens as expected, the Bitcoin price does not have to behave as it did in earlier periods. The halving reduces new supply, but the market price is determined by supply and demand at the time.
In its May 2025 Financial Stability Review, the European Central Bank describes how the halving reduces the issuance of new bitcoins while also affecting miner income. This shows that the effect is not only about scarcity. It also affects the businesses that keep the network running.
Watch out: A 51 percent decline may look like a buying opportunity when compared with previous recoveries. But Bitcoin has fallen much further during earlier bear markets. A historical pattern does not tell you how much further the price could fall.
Questions to ask before using the cycle
- Are you looking at the actual halving date or just the calendar year?
- Are you comparing prices with previous peaks and bottoms in the same way?
- Are you accounting for interest rates, liquidity and the wider stock market?
- Could you withstand a further decline without having to sell at an unfavourable time?
- Are you using the cycle as background information or as the only reason for a decision?
The four year Bitcoin cycle remains a useful historical framework for understanding market movements. The repetition is striking, but the market is changing and the cycle does not provide exact buying or selling dates. This is educational information, not financial advice.